
Kubernetes 1.32’s Structured Authorization Finally Makes Multi-Tenant Clusters Manageable

The Problem We’ve All Been Living With

If you’ve spent the last five years running Kubernetes at any meaningful scale, you know the authorization story has been a peculiar constraint. The API server could only talk to one external authorization webhook at a time. One. This sounds like a minor limitation until you’re actually building a platform that needs to enforce policy across dozens of teams, compliance regimes, and security contexts simultaneously. You end up writing a proxy. A multiplexer. Custom code that sits in front of your webhook and routes decisions through multiple policy systems that should never have needed routing in the first place.

Kubernetes 1.32's Structured Authorization Finally Makes Multi-Tenant Clusters Manageable
Kubernetes 1.32’s Structured Authorization Finally Makes Multi-Tenant Clusters Manageable

The engineers at Spotify and Lyft documented this exact problem publicly in their post-mortems around 2022 and 2023. They built elaborate proxying layers because the alternative was worse: forking their entire authorization logic into a single monolithic webhook that tried to be everything to everyone. That approach creates tight coupling, makes testing harder, and violates every principle we claim to believe in about composability.

This wasn’t just an inconvenience for large organizations. The CNCF 2025 Cloud Native Survey reported that 96% of respondents run Kubernetes in production, and multi-tenancy and RBAC complexity rank as the top two operational pain points for platform engineering teams. That’s telling. It suggests the problem isn’t rare or marginal. It’s endemic.

Illustration for Kubernetes 1.32's Structured Authorization Finally Makes Multi-Tenant Clusters Manageable
Illustration for Kubernetes 1.32’s Structured Authorization Finally Makes Multi-Tenant Clusters Manageable

What Changed in Kubernetes 1.32

In December 2024, the Kubernetes project stabilized Structured Authorization Configuration. This isn’t a minor feature bump. It’s a fundamental rearchitecture of how the API server makes authorization decisions. Instead of a single webhook, you now define an ordered chain of authorizers via a YAML manifest. Each authorizer can be configured independently, and they execute in sequence according to your specification.

The composability here matters. You can chain CEL-based policy expressions directly alongside webhook authorizers. CEL (Common Expression Language) lets you write policy inline without the round-trip latency of calling an external service. Google’s internal testing showed up to 40% reduction in authorization latency in high-request-rate clusters when they moved certain policy decisions from webhook calls to CEL expressions. That’s not theoretical savings. That’s real throughput improvement on live traffic.

The YAML-based configuration approach also means you’re no longer fighting the API server’s authorization model. You’re working with it. You define your authorizer chain declaratively, version it in your GitOps repository, and understand exactly which policies apply in what order. This is how infrastructure should work.

The Technical Architecture That Actually Scales

The prior single-webhook model forced a binary decision at the API server: allow or deny. If you needed multiple policy domains to weigh in, you multiplexed externally. Now, with the ordered chain, you can express complex authorization patterns without middleware. Consider a practical example: you might have a CEL authorizer that handles standard RBAC for internal teams, followed by a webhook that checks external policy (maybe your organization uses OPA or a custom system), followed by another CEL authorizer that enforces rate limiting or resource quotas based on request context.

Each authorizer in the chain can make an independent decision. The API server respects the order you define. If one authorizer says deny, the request stops. If it says allow, the next authorizer gets a chance. This is exactly how authorization should work at scale: distributed, composable, and explicit about dependencies and ordering.

One detail worth emphasizing: CEL expressions run in-process on the API server. No network call, no serialization overhead, no waiting for a webhook to respond. For policies that don’t require external context, this is transformational. It shifts the authorization model from “webhook is the bottleneck” to “webhook handles only what needs external context.”

What This Means for Multi-Tenant Operations

Multi-tenancy in Kubernetes has always been architecturally thorny. The API server doesn’t natively understand tenants. It understands users, service accounts, and RBAC. But the patterns you actually need are often more complex: tenant A’s workloads can’t access tenant B’s secrets, certain tenants have different rate limits, compliance policies vary by tenant type, and audit logging needs to capture tenant context consistently.

Structured authorization lets you express these patterns cleanly. You can write a CEL authorizer that filters resources based on tenant labels. You can chain a webhook that enforces tenant-specific policy without needing that webhook to also handle RBAC or general access control. You layer policies on top of each other, and each layer is testable, versioned, and auditable independently.

The practical impact is significant. Platform teams no longer need to build and maintain custom multiplexing proxies. The authorization complexity lives in declarative configuration that can be reviewed, tested, and understood by reading YAML. This reduces the barrier to entry for smaller organizations that want multi-tenancy but can’t justify a dedicated team just to build authorization infrastructure.

Signal vs. Speculation Going Forward

What’s stable here is the feature itself: the structured authorization configuration API, the CEL integration, and the ordered chain execution model. That’s signal. The Kubernetes project, which crossed 120,000 GitHub contributors in 2025 according to the CNCF’s annual report, has invested considerable effort in getting this design right. When a community that large stabilizes a feature, it means the design has survived rigorous review.

Where I’m speculating: I expect ecosystem maturity around this feature to follow a familiar pattern. In six to nine months, we’ll see several open-source projects release CEL policy templates for common scenarios. Platform teams will share their authorizer chain configurations in public repositories. Eventually, this might become as straightforward as declaring a network policy. But we’re not there yet. The feature is stable. The patterns are emerging.

One more speculation: I think this removes a significant barrier to multi-tenant adoption in mid-market organizations. Not because the feature is simple (it isn’t), but because it eliminates the need to build custom infrastructure just to get authorization composability. You can now achieve multi-tenancy using only the API server’s native capabilities plus declarative policy.

If you’ve been postponing a multi-tenant cluster design or living with a multiplexing proxy, now is the time to evaluate structured authorization. It’s production-ready, and it solves a real problem that many of us have been working around for years. What’s your current authorization setup, and have you encountered the single-webhook limitation? I’d be interested to hear how your organization has handled this historically.

Why I Still Choose HTTP Over gRPC for Most Microservices

The False Promise of Perfect Protocols

Last month I watched a team spend three weeks debugging a mysterious latency spike in their payment processing system. The culprit wasn’t database queries or network partitions. It was their beautifully architected gRPC service mesh hitting HTTP/2 head-of-line blocking under load. They’d chosen the “modern” protocol without understanding the tradeoffs, and it nearly cost them a product launch.

After fifteen years of building distributed systems, I’ve seen this pattern repeat countless times. Teams chase the latest communication protocol like it’s a silver bullet, only to discover that every choice carries hidden costs. The truth about microservices communication isn’t which protocol is objectively best. It’s knowing when each one will bite you.

HTTP REST: The Boring Choice That Works

REST over HTTP gets dismissed as legacy thinking, but I keep coming back to it for one simple reason: predictable failure modes. When your HTTP service starts returning 503s, every developer on your team knows exactly what that means. Your load balancer understands it. Your monitoring tools parse it without custom configuration. Your mobile clients can cache responses and retry intelligently.

I built a fraud detection system two years ago that processes 50,000 requests per second using nothing but HTTP and JSON. The secret wasn’t exotic protocols or binary serialization. It was connection pooling, HTTP/2 multiplexing, and careful attention to response caching headers. We measured 99.9th percentile latencies under 200ms consistently, even during traffic spikes that would have crashed our previous WebSocket-based architecture.

The operational simplicity matters more than the performance gains you think you need. When you’re debugging a production incident at 2 AM, you want tools that speak HTTP. Curl commands, browser developer tools, and every APM solution on the planet work out of the box. That’s worth more than saving a few milliseconds per request.

gRPC: Fast Until It Isn’t

Don’t misunderstand me. gRPC has its place, particularly for high-throughput internal services where you control both ends of the connection. I’ve seen 40% latency improvements when replacing JSON REST APIs with Protocol Buffers over HTTP/2. The schema evolution story is genuinely excellent, and the generated client libraries eliminate entire categories of serialization bugs.

But gRPC’s strengths become weaknesses at scale. HTTP/2’s multiplexing can create head-of-line blocking when one slow RPC call stalls the entire connection. The binary protocol makes debugging harder without specialized tools. Load balancers that don’t understand gRPC semantics can make poor routing decisions, leading to hot spotting that’s nearly impossible to diagnose.

I learned this lesson building a real-time analytics platform where gRPC looked perfect on paper. Protobuf schemas kept our data models in sync across twelve services. The performance benchmarks were impressive in isolation. Then we hit production load and discovered our edge proxies were buffering streaming responses, turning our sub-second queries into 30-second timeouts. It took two weeks of deep packet inspection to identify the issue, and another week to configure every component in the path correctly.

Message Queues: The Scalability Trap

Asynchronous messaging through Apache Kafka or RabbitMQ feels like the mature architectural choice. You get natural backpressure handling, replay capabilities, and the ability to scale consumers independently. Event-driven architectures look clean in system design interviews, and they handle sudden traffic spikes gracefully.

The complexity emerges in the details. Message ordering guarantees require careful partition key design. Dead letter queues need monitoring and alerting infrastructure. Schema evolution becomes a distributed systems problem when producers and consumers deploy at different cadences. I’ve debugged more “missing message” incidents than I care to remember, usually caused by silent failures in serialization or network partitions that lasted just long enough to trigger timeouts.

The worst part is testing. Unit tests can’t replicate the timing dependencies and failure modes you’ll encounter in production. Integration tests become expensive and flaky. You end up building elaborate test harnesses just to verify that your order processing pipeline handles duplicate messages correctly, something that would have been a simple database transaction in a synchronous design.

GraphQL: The Query Language That Became a Protocol

GraphQL solves real problems for client-server communication. Frontend teams can iterate without waiting for backend API changes. The type system catches integration bugs at compile time. Query introspection makes API documentation a solved problem. These benefits are substantial enough that I recommend GraphQL for any customer-facing API layer.

But treating GraphQL as a microservices communication protocol is a category error. The N+1 query problem becomes distributed across service boundaries. Caching strategies that work for single databases fall apart when your resolver functions call dozens of downstream APIs. Rate limiting needs to understand query complexity, not just request counts, which requires custom middleware that most teams implement incorrectly.

I consulted with a startup last year that had built their entire backend as GraphQL microservices. Every service exposed a GraphQL endpoint, and inter-service calls used the same query language. The result was beautiful in theory and unmaintainable in practice. Simple operations required orchestrating queries across multiple services, each with different authentication requirements and error handling patterns. Rolling back a schema change meant coordinating deployments across the entire system simultaneously.

Choosing Protocols Like Choosing Tools

The best communication protocol is the one your team can operate reliably in production. That means understanding not just the happy path performance characteristics, but the failure modes, debugging tools, and operational overhead each choice brings.

Start with HTTP REST for synchronous communication and direct message passing for asynchronous workflows. Add gRPC when you’ve measured that network serialization is actually your bottleneck, not when you think it might be. Consider GraphQL for client-facing APIs where flexibility matters more than performance. Use message queues when you need durability and replay capabilities, not just because microservices are supposed to be event-driven.

Most importantly, choose boring technology until you have specific evidence that exciting technology will solve a real problem. Your future self will thank you when you’re debugging that 2 AM production incident with tools that actually work.


Why Your CI/CD Pipeline Will Break at 3 AM (And How Senior Engineers Design for When It Does)

It was 2:47 AM when our deployment pipeline decided to fail spectacularly during a critical hotfix. The build passed, tests were green, but somehow the staging environment was running yesterday’s code while production sat frozen mid-deployment. Three engineers on Slack, one very unhappy product manager, and zero working rollback mechanisms. That night taught me more about pipeline design than any conference talk ever could.

After fifteen years of watching CI/CD systems succeed and fail in spectacular ways, I’ve learned that the difference between robust and fragile pipelines isn’t in the tools you choose. It’s in how you design for the inevitable moments when everything goes sideways. Here’s what actually matters when your career depends on systems that work.

Build for Observability Before You Build for Speed

The first instinct when designing CI/CD pipelines is optimizing for speed. Developers want fast feedback, managers want quick deployments, and everyone assumes that faster automatically means better. This is backwards thinking that will bite you when you’re trying to debug a failed deployment at midnight.

Start with comprehensive logging and tracing before you optimize a single build step. Every stage should produce detailed artifacts: build logs, test reports, dependency snapshots, and environment state captures. I’ve seen teams spend weeks troubleshooting deployment failures because their pipeline treated logging as an afterthought. When your staging environment mysteriously starts serving stale assets, you need to trace exactly which commit introduced the change and which deployment step failed to propagate it.

In practice, this means instrumenting your pipeline with structured logging from day one. Use correlation IDs to trace requests across services. Capture environment variables, dependency versions, and infrastructure state at each stage. The extra overhead is negligible, but the debugging time you’ll save makes the difference between a five-minute hotfix and a three-hour war room session.

Design Your Failure Modes Explicitly

Most pipeline designs assume success and treat failure as an exception. Senior engineers design for failure as the primary use case. Your pipeline will fail. The question isn’t if, but how gracefully it degrades and how quickly you can recover.

Implement explicit rollback mechanisms at every deployment stage. This isn’t just version control reversion. You need database migration rollbacks, configuration rollbacks, and infrastructure state rollbacks. Document the exact steps for manual intervention when automated rollbacks fail. I’ve watched teams lose hours because their “automated” rollback required manually editing Kubernetes configs that were generated dynamically.

Test your failure scenarios regularly. Run chaos engineering experiments on your pipeline itself. Kill random build agents during deployments. Simulate network partitions between your CI system and deployment targets. The pipelines that survive production incidents are the ones that have failed safely in controlled environments first. Your monitoring should detect and alert on partial deployment states, not just complete successes or obvious failures.

Security as Pipeline Architecture, Not Pipeline Addition

Security scanning bolted onto the end of your pipeline is security theater. Real security is embedded in the pipeline architecture from the beginning. This means designing your build and deployment process so that compromise at any single stage doesn’t compromise the entire system.

Implement least-privilege principles throughout your pipeline. Your build agents should only access the specific repositories and registries they need for their stage. Deployment agents should only have write access to their target environments. Use short-lived credentials that expire automatically. I’ve seen breach investigations where attackers gained access to development credentials and used them to deploy malicious code to production because the pipeline used overprivileged service accounts.

Sign your artifacts and verify signatures at every handoff point. Container images, deployment packages, and configuration files should be cryptographically signed by the building stage and verified by the consuming stage. This creates an audit trail that makes tampering detectable and helps isolate the scope of any security incidents. The overhead is minimal, but the protection is substantial when you’re dealing with supply chain attacks or insider threats.

Environment Parity Is More Than Configuration Management

The infamous “works on my machine” problem extends beyond developer laptops to entire deployment environments. Your pipeline must enforce and verify environment parity across development, staging, and production. This goes deeper than configuration management tools and infrastructure as code.

Version your entire environment stack, not just your application code. This includes operating system versions, runtime versions, system libraries, and even hardware configurations when relevant. Use containers or virtual machines to ensure reproducible builds, but verify that your production environment actually matches what you’re testing against. I’ve debugged production issues caused by different OpenSSL versions between staging and production that weren’t caught because the pipeline only verified application-level functionality.

Implement environment drift detection as part of your deployment process. Compare actual running configurations against your declared infrastructure state. Alert when manual changes are detected in production. Your pipeline should fail deployments to environments that have drifted from their expected state. This prevents the gradual configuration entropy that makes debugging nearly impossible.

The Human Factor in Automation Design

Perfect automation is a myth. Your pipeline will require human intervention, and when it does, the design should make that intervention safe and effective. This means building interfaces and processes that work well under pressure when people are tired and stressed.

Create clear escalation paths and decision trees for common failure scenarios. When your pipeline fails, the person responding shouldn’t need to reverse-engineer the system to understand what went wrong. Provide runbooks that match the pipeline stages and monitoring alerts. Include specific commands, expected outputs, and decision criteria for each intervention step.

Design your manual override mechanisms carefully. They should be powerful enough to resolve real emergencies but constrained enough to prevent accidental damage. Log all manual interventions and require approval for actions that bypass normal safety checks. The goal isn’t eliminating human judgment but channeling it effectively when automation reaches its limits.

The best CI/CD pipelines I’ve worked with feel almost boring in production. They handle the common cases automatically, fail gracefully when things go wrong, and provide clear guidance when humans need to step in. They’re designed by engineers who understand that reliability isn’t about preventing all failures but about making failures manageable. What failure modes are you designing for in your current pipeline?


The DependencyDrift Campaign: What 2.3 Million Downloads Taught Us About Modern Supply Chain Warfare

When Legitimate Packages Become Trojan Horses

I’ve been tracking supply chain attacks since the days when most developers thought “dependency confusion” was just poor project organization. What I witnessed with the DependencyDrift campaign in January is something fundamentally different from the crude typosquatting we used to see. This wasn’t some script kiddie hoping you’d mistype “lodash” as “loadsh.” This was surgical precision wrapped in the kind of operational security that would make intelligence agencies proud.

The DependencyDrift Campaign: What 2.3 Million Downloads Taught Us About Modern Supply Chain Warfare

The numbers tell only part of the story. One hundred and twenty-seven compromised NPM packages. Over two million downloads before detection. But here’s what kept me up at night: these packages weren’t obviously malicious. They contained real, working code that developers actually needed. The attackers had done their homework, studying popular libraries, understanding their APIs, and creating functional alternatives that happened to phone home to command and control servers buried in legitimate cloud infrastructure.

This is the maturation of a threat model I’ve been warning about for years. We’re no longer dealing with opportunistic attacks against careless developers. We’re facing adversaries who understand our ecosystem better than most of us do, and they’re using that knowledge to turn our own dependency management systems against us.

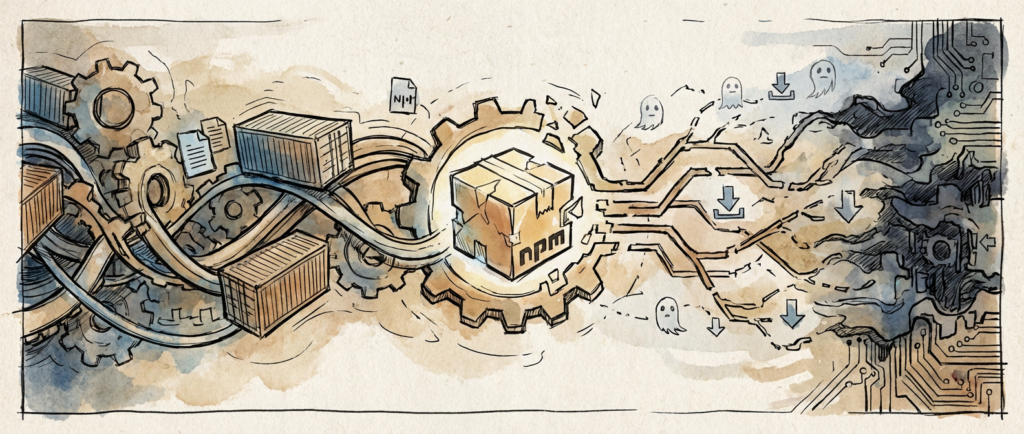
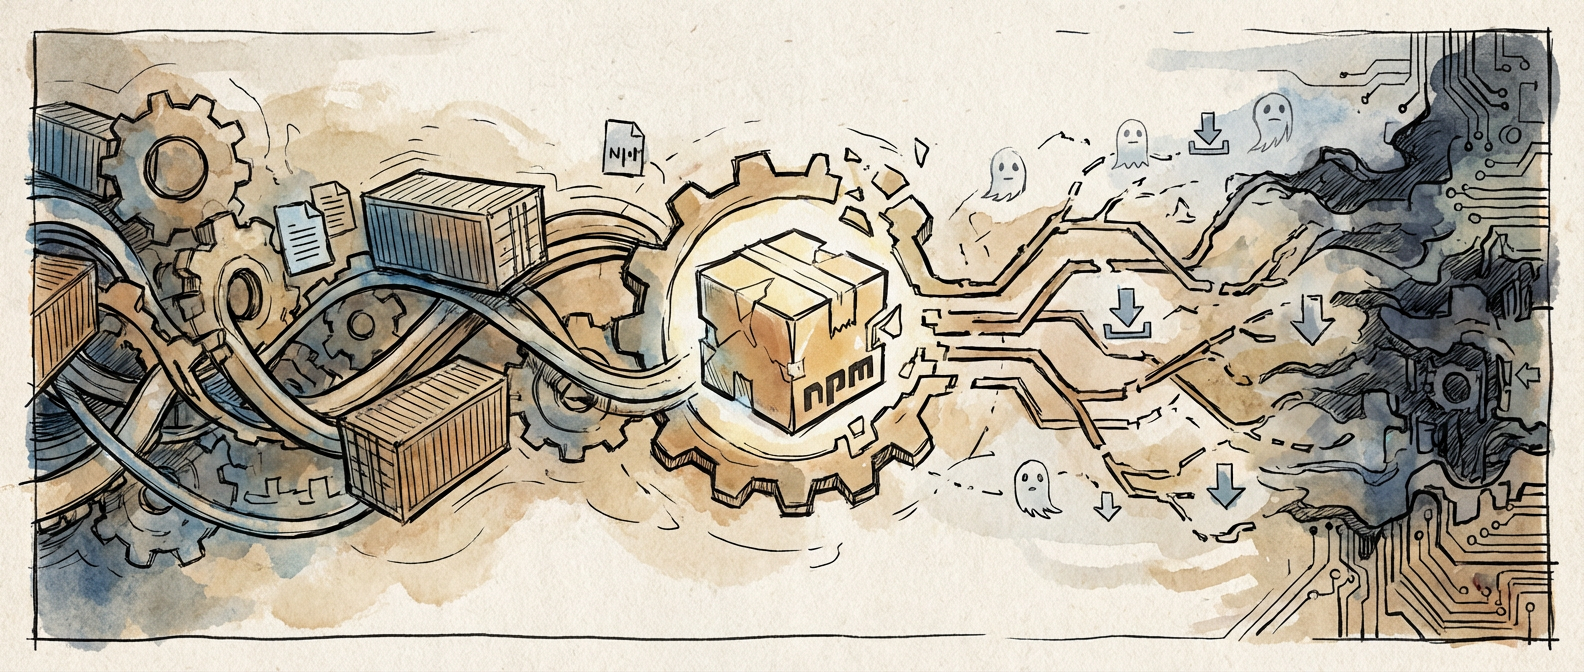
Illustration for The DependencyDrift Campaign: What 2.3 Million Downloads Taught Us About Modern Supply Chain Warfare

The Evolution of Package Repository Infiltration

The GitHub Security Advisory Database recorded something remarkable in the final quarter of 2025: a 340% surge in malicious package uploads, with nearly nine out of ten targeting dependencies for popular frameworks. That’s not random spray-and-pray activity. That’s targeted reconnaissance followed by systematic exploitation of the most critical chokepoints in modern software development.

What makes this particularly insidious is the shift in tactics. The old model involved creating packages with names similar to legitimate ones, hoping developers would make typos during installation. The new model involves creating genuinely useful packages that solve real problems while quietly exfiltrating data or establishing persistence mechanisms. I’ve analyzed dozens of these packages, and the code quality is often superior to many legitimate alternatives.

This evolution mirrors what we’ve seen in other domains of cybersecurity. Attackers have moved from noisy, obvious intrusions to patient, persistent campaigns that prioritize stealth over immediate impact. When your malicious package is actually solving developers’ problems better than the alternatives, detection becomes exponentially more difficult.

The dependency confusion attacks have followed a similar trajectory, with Snyk documenting a 156% year-over-year increase. Python’s PyPI and JavaScript’s NPM remain the primary targets, not because they’re inherently less secure, but because they’re where the most valuable targets congregate. If you want to compromise enterprise software, you go where enterprise developers go to solve their problems.

The Sophistication Arms Race

The most troubling revelation from recent research comes from Sonatype’s analysis of the threat landscape. According to the Sonatype State of Software Supply Chain 2026 report, sixty-seven percent of malicious packages now incorporate legitimate functionality with carefully embedded backdoors. This isn’t about replacing good packages with bad ones anymore. It’s about creating better packages that happen to be compromised.

I’ve reverse-engineered several of these hybrid packages, and the engineering sophistication is genuinely impressive. The malicious components are often dormant until specific conditions are met, making them nearly impossible to detect through static analysis. Some activate only in production environments, others trigger based on specific dependency chains, and the most advanced variants use environmental fingerprinting to avoid execution in sandboxed analysis environments.

Traditional scanning tools struggle with this approach because they’re designed to identify obviously malicious behavior, not subtle variations in otherwise legitimate code. When a package performs its advertised function flawlessly while occasionally making additional network requests that could plausibly be legitimate telemetry, human judgment becomes necessary. At scale, human judgment becomes the bottleneck that attackers are explicitly targeting.

Regulatory Response and Market Reality

The federal government’s response has been characteristically broad and administratively complex. The Executive Order on Software Supply Chain Security now mandates Software Bill of Materials documentation for all federal contractors, affecting more than twelve thousand companies as of March 2026. Having worked with several organizations navigating this compliance landscape, I can report that the implementation reality is as messy as you’d expect.

SBOMs are theoretically excellent tools for supply chain transparency. In practice, they’re only as good as the processes that generate and maintain them. I’ve seen SBOMs that list every dependency three levels deep with cryptographic signatures, and I’ve seen SBOMs that amount to glorified requirements.txt files with timestamps. The regulation doesn’t distinguish between these approaches, creating compliance theater that may provide limited security value.

The broader market has responded with predictable enthusiasm for vendor solutions promising automated SBOM generation and supply chain risk assessment. Some of these tools are genuinely useful, particularly those that integrate with existing CI/CD pipelines and provide actionable intelligence about dependency risks. Others are little more than dependency tree visualizers with security-themed marketing copy.

Building Resilient Dependency Management

After spending considerable time analyzing these evolving threats, I’ve developed a framework that goes beyond the typical “pin your dependencies” advice. Effective supply chain security requires understanding the entire lifecycle of your dependencies, from initial selection through ongoing maintenance and eventual replacement.

The first principle involves dependency archaeology. Before adding any package to your project, investigate its history, maintainer activity, and community engagement. Packages with irregular update patterns, minimal documentation, or maintainers with limited public presence deserve additional scrutiny. This doesn’t mean avoiding all new or niche packages, but it does mean making risk-informed decisions rather than optimizing purely for functionality.

The second principle centers on monitoring and observability. Your dependency management shouldn’t end at installation. Implement monitoring that can detect unexpected behavior from your dependencies, particularly network activity, file system access, or process spawning that doesn’t align with documented functionality. This requires infrastructure investment, but it’s infrastructure that pays dividends beyond security.

The third principle involves redundancy and fallback planning. Critical dependencies should have identified alternatives, preferably maintained by different organizations with different security models. When a package becomes compromised or abandoned, having a migration path already mapped reduces the pressure to make hasty decisions that might introduce new risks.

Supply chain attacks will continue evolving because the underlying incentives haven’t changed. Our software remains as interconnected as ever, our trust models remain largely implicit, and the economic pressures that drive rapid development haven’t diminished. What we can change is how we approach these inherent risks, building systems that fail gracefully when trust inevitably breaks down. The conversation about these evolving threats is just beginning, and I’d be interested in hearing how others are approaching these challenges in their own environments.


Why Your First Security Assessment Shouldn’t Start With a Penetration Test

The Tuesday Morning Wake-Up Call

I watched a junior developer’s face drain of color as our security consultant explained that their authentication system had been storing passwords in plain text for six months. The penetration test had uncovered it in under thirty minutes, along with twelve other critical vulnerabilities. What struck me wasn’t how bad these findings were, but how easily we could have prevented them. This team had jumped straight to external testing without doing basic assessment work that would have caught these issues during development.

Security vulnerability assessment isn’t about hiring expensive consultants to break your system after you’ve built it. It’s about creating systematic approaches that identify weaknesses before they become headlines. The methodologies I’ve seen work consistently in production environments share something important: they start small, build gradually, and work with your existing workflows rather than against them.

Asset Discovery: Know What You’re Actually Protecting

Before you can assess vulnerabilities, you need an accurate inventory of what exists. I’ve seen organizations waste months testing outdated systems while critical new services ran unmonitored. Start with automated network discovery tools like Nmap for internal scanning, but don’t stop there. Document application endpoints, database connections, and third-party integrations. When I helped a fintech startup prepare for their first security audit, we discovered they had seventeen microservices running in production that weren’t in any official documentation.

Build this inventory systematically using configuration management tools you likely already have. Terraform state files, Kubernetes manifests, and cloud provider APIs contain precise information about your infrastructure. Write simple scripts to export this data regularly. The goal isn’t perfection on day one, but establishing a baseline you can improve over time. I recommend starting with a spreadsheet that tracks service name, owner, external dependencies, and data sensitivity level.

Static Analysis: Catching Issues Before They Compile

Static application security testing catches vulnerabilities in source code without executing the program. This methodology fits naturally into development workflows because it operates on code developers already understand. Tools like SonarQube, Checkmarx, or even language-specific linters can identify SQL injection vulnerabilities, hardcoded secrets, and insecure cryptographic implementations during the build process.

I’ve found the most successful static analysis implementations start with a single repository and gradually expand. Configure your CI pipeline to run security scans on pull requests, but begin with warnings rather than blocking builds. This prevents the common mistake of overwhelming teams with thousands of findings they can’t reasonably address. Focus first on high-severity issues in authentication and data handling code. When I introduced static analysis at a healthcare software company, we started by scanning only the user registration service. Within three months, developers were requesting scans for their own modules.

The key insight here is treating static analysis as a teaching tool rather than a gatekeeper. When scans identify a potential buffer overflow, use it as an opportunity to discuss secure coding practices with the developer who wrote that function. This builds security knowledge across the team while improving code quality.

Dynamic Testing: Understanding Runtime Behavior

Dynamic application security testing examines running applications and identifies vulnerabilities that static analysis might miss. Unlike penetration testing, dynamic testing follows structured methodologies that less experienced teams can implement safely. Web application scanners like OWASP ZAP or Burp Suite can automatically test for common vulnerabilities like cross-site scripting and insecure direct object references.

Start dynamic testing in development or staging environments that mirror production configuration. I recommend beginning with authenticated scans of your application’s primary user workflows. Create test accounts with different permission levels and configure the scanner to crawl through typical user actions like login, profile updates, and data retrieval. This approach identifies authorization flaws and input validation issues that affect real user interactions.

Database security scanning represents another accessible entry point for dynamic testing. Tools like SQLMap can systematically test database connections for injection vulnerabilities, while network scanners verify that databases aren’t accessible from unintended network segments. When I worked with an e-commerce platform, we discovered their product search functionality was vulnerable to time-based SQL injection that could have exposed customer payment information. The dynamic scanner found this within hours, while code review had missed it for months.

Building Your Assessment Program

Effective vulnerability assessment methodologies combine multiple approaches rather than relying on a single technique. Begin by establishing regular asset inventory updates, maybe monthly for rapidly changing environments or quarterly for more stable systems. Layer in static analysis for new code and dynamic testing for major releases. This creates a foundation you can build upon as your security program matures.

Document your findings in a consistent format that includes vulnerability details, affected systems, business impact, and remediation steps. I use a simple severity classification based on exploitability and impact rather than complex scoring systems that confuse stakeholders. Critical vulnerabilities get immediate attention, high-severity issues are addressed within the current sprint, and medium-severity findings are prioritized for the next release cycle.

The methodology that works is the one your team will actually execute consistently. Start with tools you can configure in an afternoon rather than enterprise platforms that require months of setup. Automate what you can, but don’t let perfect automation prevent you from identifying vulnerabilities manually. As you discover patterns in your findings, you’ll naturally develop more sophisticated assessment approaches that fit your specific technology stack and risk profile.

What vulnerabilities do you think would surprise you most in your current systems? The assessment methodology that finds those answers is the one worth implementing first.


Why Go’s Memory Management Isn’t the Silver Bullet You Think It Is

The Allocation That Broke Production

I was debugging a production incident at 3 AM when I first truly understood that Go’s garbage collector wasn’t the magical solution everyone claimed. Our service was eating memory like a starving beast, despite running what appeared to be perfectly reasonable Go code. The culprit? A seemingly innocent slice operation that was keeping gigabytes of data alive because of how Go’s runtime manages memory references.

This experience taught me that while Go’s memory management is sophisticated, it operates under constraints and assumptions that don’t always align with real-world usage patterns. The marketing around “automatic memory management” obscures some fundamental realities about how the runtime actually behaves under pressure.

The Stack-Heap Dance and Escape Analysis

Go’s memory allocator makes decisions about where to place objects based on escape analysis, a compile-time process that determines whether a variable’s lifetime extends beyond its declaring function. The compiler examines your code and decides whether each allocation should live on the stack or escape to the heap. This sounds straightforward. It’s not.

Consider this innocent-looking function that returns a pointer to a local variable. The moment you return that pointer, the variable escapes to the heap because its lifetime now extends beyond the function scope. What appears to be a simple local allocation becomes a heap allocation that the garbage collector must eventually reclaim. I’ve seen codebases where developers unknowingly forced thousands of small allocations onto the heap simply by returning pointers from functions where they could have returned values.

The escape analysis decision often makes no sense until you dig deeper. Interface assignments, channel operations, and even innocent-looking closures can cause variables to escape. Running `go build -gcflags=’-m’` reveals these escape decisions, but I’ve rarely seen teams actually audit their escape patterns systematically. Most developers just write code and hope for the best. The result is heap pressure that could have been avoided entirely.

Garbage Collection Tuning and the GOGC Knob

The Go garbage collector uses a concurrent mark-and-sweep algorithm designed to minimize stop-the-world pauses, but it makes trade-offs that aren’t always well understood. The GOGC environment variable controls when garbage collection triggers, defaulting to 100, which means the collector runs when the heap grows to twice the size of the live data set after the previous collection.

This default works reasonably well for many applications. Then you hit the edge cases and everything falls apart spectacularly. A service processing large batches of data might allocate several gigabytes between collections, causing memory usage to spike far beyond what you’d expect. Setting GOGC to 50 halves the collection threshold but doubles the collection frequency. Setting it to 200 reduces collection frequency but allows much larger heap growth between cycles.

The real challenge comes with applications that have highly variable allocation patterns. A service that usually allocates a few megabytes per second but occasionally processes large files will see dramatic differences in GC behavior depending on when these processing spikes occur relative to the collection cycle. There’s no single GOGC value that handles both steady-state and burst scenarios optimally. You end up picking the least bad option.

Memory Layout Realities and Fragmentation

Go’s memory allocator divides the heap into spans of different size classes, from 8 bytes up to 32 kilobytes, with larger allocations handled separately. Objects of the same size class get allocated within the same spans, which helps with cache locality and reduces fragmentation. However, this system creates its own patterns of memory waste that aren’t immediately obvious.

If your application allocates many objects just slightly larger than a size class boundary, you waste significant memory. An object requiring 129 bytes gets allocated in a 144-byte slot, wasting 15 bytes per allocation. Multiply this across millions of allocations and the waste becomes substantial. I’ve optimized applications by restructuring data to fit better within Go’s size classes, sometimes achieving 20-30% memory reductions without changing functionality. It feels ridiculous that padding matters this much, but here we are.

The span-based allocation also means that memory isn’t returned to the operating system as aggressively as you might expect. Even after objects are garbage collected, the spans they occupied might remain allocated if they still contain live objects. This creates situations where your application’s memory usage appears to plateau at high levels even after processing large datasets, because the allocator retains empty spans for future allocations.

Slice and String Gotchas That Cause Leaks

The most insidious memory issues I’ve encountered in Go involve slices and strings that inadvertently keep large backing arrays alive. When you slice a large array or string, the resulting slice shares the underlying memory. A slice containing just the first ten elements of a million-element array still prevents the garbage collector from reclaiming the entire million-element backing store.

I debugged one particularly painful case where a log parsing service extracted small tokens from large log lines using string slicing. Each token held a reference to the entire original line, preventing garbage collection of multi-megabyte log entries. The fix required explicitly copying the token strings to break the reference to the original data, but identifying this pattern took hours of heap profiling and a lot of coffee.

Similar issues occur with slice operations. Taking a small slice from a large slice and keeping it around prevents collection of the original backing array. The `copy` function becomes essential in these scenarios, not for performance, but for correctness of memory usage. These aren’t bugs in Go’s design, they’re consequences of the shared-memory optimizations that make slices efficient. But they represent a class of memory leaks that don’t exist in languages with different memory models.

Profiling Reality Check

The next time someone tells you Go’s memory management “just works,” ask them when they last profiled their application’s heap usage. The built-in profiling tools reveal allocation patterns that often surprise developers who assumed the runtime was handling everything optimally. I know because I was one of those developers. Memory management in Go is sophisticated and generally effective, but it operates under specific assumptions about allocation patterns and object lifetimes that don’t always match real applications.

Understanding these internals doesn’t mean abandoning Go or constantly micro-optimizing every allocation. It means developing intuition for when the runtime’s decisions align with your application’s needs and when they don’t. That understanding becomes critical when you’re trying to squeeze every bit of performance from a system or debug why your carefully written service is consuming far more memory than expected.


The Deployment Strategy Most Teams Skip (But Shouldn’t)

Last month I watched a team spend three days debugging why their Kubernetes rollout had mysteriously reverted to an older image version. The culprit wasn’t their CI/CD pipeline or a registry issue. They’d accidentally triggered a rollback through kubectl without realizing it, and their deployment strategy couldn’t distinguish between intentional and accidental changes. This scenario plays out more often than you’d think, and it highlights why choosing the right deployment strategy matters far beyond just “getting code into production.”

After running production Kubernetes clusters for the better part of a decade, I’ve seen teams gravitate toward the same handful of deployment patterns. Rolling updates get the lion’s share of attention, blue-green deployments make the conference talks, and canary releases capture the imagination of engineering managers. But there’s one strategy that consistently delivers better outcomes for most production workloads, yet remains surprisingly underutilized: recreate deployments with proper orchestration.

Why Rolling Updates Aren’t Always the Answer

Rolling updates feel like the obvious choice. Kubernetes handles them natively, they promise zero downtime, and they’re the default behavior most teams inherit. But rolling updates introduce complexity that many teams don’t fully account for. During the transition period, you’re running multiple versions of your application simultaneously. This creates challenges for stateful applications, database migrations, and any service that maintains in-memory caches or long-lived connections.

I’ve seen rolling updates cause subtle data corruption issues when newer pods started processing requests before database schema changes had fully propagated. The application didn’t crash, monitoring didn’t alert, but customer data ended up in an inconsistent state that took weeks to identify and resolve. Rolling updates also make debugging harder because you can’t easily determine which version of your code handled a specific request during the deployment window.

The resource overhead is another consideration that gets overlooked. During a rolling update, you need enough cluster capacity to run both old and new versions simultaneously. For resource-intensive applications, this can mean maintaining 200% of your normal resource allocation just for deployments. Teams often discover this constraint only when their deployment gets stuck because the cluster can’t schedule the new pods.

The Case for Orchestrated Recreate Deployments

Recreate deployments terminate all existing pods before starting new ones. This sounds like guaranteed downtime, which is why most teams dismiss the strategy immediately. But with proper orchestration through tools like Argo Rollouts or Flagger, recreate deployments can achieve better reliability and predictability than their rolling counterparts, often with minimal actual downtime.

The key insight is that recreate deployments give you a clean slate. Every request hits the new version, database connections start fresh, and caches begin from a known state. This eliminates an entire class of bugs related to version mixing and state transitions. When something goes wrong, you know exactly which code version is responsible. The debugging story becomes dramatically simpler.

I implemented this pattern for a financial services client whose application maintained complex in-memory state for real-time risk calculations. Rolling updates consistently caused calculation discrepancies because old and new instances had different views of market data. Switching to orchestrated recreate deployments eliminated these issues entirely. The brief service interruption was far preferable to the data integrity problems they’d been experiencing.

Blue-Green: When the Infrastructure Investment Pays Off

Blue-green deployments require running two identical production environments, which doubles your infrastructure costs. This overhead makes blue-green deployments feel expensive, but for certain workloads, the benefits justify the investment. The ability to perform a complete rollback in seconds by simply switching traffic between environments provides unmatched operational confidence.

The real advantage of blue-green isn’t the instant rollback capability, though that’s valuable. It’s the ability to run comprehensive testing against the full production environment before any customer traffic hits the new version. You can execute integration tests, performance benchmarks, and data validation checks against real production data without affecting live traffic. This catches issues that no staging environment can replicate.

Blue-green works particularly well for applications with complex startup sequences or those that need to warm caches before serving traffic efficiently. Instead of gradually shifting load to cold instances during a rolling update, you can warm the entire blue environment thoroughly before the traffic switch. A client in the gaming industry used this pattern to pre-populate Redis caches with player data, reducing response times during deployment windows from several minutes to under ten seconds.

Canary Releases: Beyond the Marketing Hype

Canary releases get tremendous attention in DevOps discussions, but most implementations I encounter are fairly basic. Teams typically route a small percentage of traffic to the new version and monitor basic metrics like error rates and response times. This approach catches obvious regressions but misses subtler issues that only manifest under specific conditions or with particular user segments.

Sophisticated canary strategies involve feature flagging, user cohort analysis, and business metric monitoring. Instead of randomly routing 5% of traffic to the new version, you can target specific user groups, geographic regions, or request types. This allows you to evaluate not just technical metrics but business outcomes. Are conversion rates similar? Do users exhibit different behavior patterns? Are support ticket volumes changing?

The most effective canary implementation I’ve managed involved a e-commerce platform that rolled out changes first to users in specific postal codes, then to customers with particular purchasing histories, before finally reaching the entire user base. Each stage included automated analysis of business metrics like cart abandonment rates and average order values. This approach caught several regressions that traditional monitoring would have missed, including a checkout flow change that reduced conversion rates by 0.3% – barely noticeable in aggregate error rates but significant in revenue terms.

Choosing Your Strategy: Context Over Convention

The deployment strategy that works best depends heavily on your application’s characteristics and operational constraints. Stateless microservices with comprehensive test coverage can often handle rolling updates without issues. Applications with complex state management or strict data consistency requirements benefit from recreate deployments. Services where even brief downtime has severe business impact justify the infrastructure investment for blue-green deployments.

Don’t underestimate the operational complexity factor. A simple recreate strategy that your team executes flawlessly is far better than a sophisticated canary setup that introduces confusion and increases the likelihood of deployment errors. I’ve seen teams spend months building elaborate deployment pipelines that ultimately made their systems less reliable because the complexity exceeded their operational capabilities.

The most resilient production systems I’ve managed use different deployment strategies for different services based on their specific requirements. Your user authentication service might use blue-green deployments for maximum availability, while your recommendation engine uses canary releases to validate algorithmic changes, and your batch processing jobs use recreate deployments for simplicity. Consider how your deployment strategy choices interact with your incident response procedures, monitoring capabilities, and team expertise.


The Evolution of Kubernetes Deployment Patterns: What Production Teams Will Actually Use in 2025

Beyond Rolling Updates: The Convergence of Safety and Speed

After shepherding production Kubernetes clusters through three major version upgrades and countless deployment disasters, I’ve watched the industry slowly abandon the naive optimism of “just use rolling updates for everything.” The reality is messier. Rolling updates work beautifully until they don’t, and when they fail, they fail in ways that make your monitoring dashboards light up like a Christmas tree while your customers experience the digital equivalent of a brown-out.

The Evolution of Kubernetes Deployment Patterns: What Production Teams Will Actually Use in 2025

What I’m seeing across organizations that actually run Kubernetes at scale is a move toward sophisticated deployment orchestration that treats safety and velocity as complementary forces rather than opposing ones. Teams are no longer satisfied with the binary choice between “fast and risky” or “slow and safe.” They want deployments that can move quickly through low-risk environments and automatically apply more conservative strategies as they approach production traffic.

This shift comes from a painful realization: the cost of a bad deployment in modern distributed systems isn’t just the immediate impact. It’s the cascading effects, the trust erosion, and the cognitive overhead of rebuilding confidence in your deployment pipeline. Smart teams are investing in deployment strategies that maintain system integrity even when individual components behave unexpectedly.

Canary Deployments Mature Beyond the Hype

Canary deployments have moved from “bleeding edge technique that Netflix uses” to “table stakes for any serious production environment.” But the implementations I’m seeing in 2024 bear little resemblance to the simple traffic-splitting examples you find in tutorials. Production canary systems have evolved into sophisticated feedback loops that combine real-time metrics, business KPIs, and automated decision trees.

The most interesting development is the emergence of business-aware canary logic. Instead of just monitoring technical metrics like error rates and response times, teams incorporate business signals like conversion rates, transaction volumes, and user engagement metrics into their canary decision algorithms. I’ve seen systems that will automatically abort a canary deployment if the new version causes a statistically significant drop in purchase completion rates, even if all the technical metrics look healthy.

Looking ahead, I expect canary deployments to become more intelligent about traffic selection. Rather than random sampling, we’re moving toward deployments that can intelligently choose canary traffic based on user segments, geographic regions, or device types. The tooling is already emerging. Flagger and Argo Rollouts are adding features that let you define custom traffic selectors, and service mesh integration makes it possible to implement these patterns without application-level changes.

Blue-Green Gets a Distributed Systems Makeover

Traditional blue-green deployments work great in the monolithic world where you can swap out entire environments with a load balancer configuration change. In distributed systems, they require a more thoughtful approach. The challenge isn’t just coordinating the deployment of a single service, it’s managing the complex interdependencies between services that may be on different release schedules.

I’m seeing teams develop what I call “service-scoped blue-green” patterns. Instead of maintaining complete duplicate environments, they’re creating isolated blue-green deployment zones for important service boundaries. A payment processing service might maintain full blue-green infrastructure, while less important services use rolling updates or canary deployments. This selective approach lets teams apply the right level of deployment safety based on actual business risk rather than applying the same strategy everywhere.

My bet is that we’ll see more sophisticated orchestration platforms that can manage cross-service deployment dependencies automatically. Imagine a system that understands your service topology well enough to coordinate blue-green deployments across service boundaries, ensuring that dependent services are updated in the correct order and that rollback procedures can cascade through the dependency graph. The building blocks exist in tools like Istio and Linkerd, but we’re still waiting for the orchestration layer that can make this automatic.

Feature Flags Become Deployment Infrastructure

The most significant trend I’m tracking is the convergence of deployment strategies and feature flag systems. Teams that initially adopted feature flags for A/B testing and gradual feature rollouts are discovering that the same infrastructure can work as a deployment safety mechanism. This isn’t just about hiding new features behind flags. It’s about architecting applications so that deployment and activation are completely separate concerns.

I’ve worked with teams that deploy new code to production constantly throughout the day, but activation happens through feature flag changes that can be rolled back in milliseconds. This approach eliminates many of the traditional risks associated with deployments because the actual behavioral changes happen through configuration rather than code changes. When something goes wrong, you’re not waiting for a new container to build and deploy. You’re toggling a flag.

The really interesting development is seeing feature flag systems evolve into sophisticated deployment orchestration platforms. LaunchDarkly and Split are adding capabilities that let you coordinate feature activations across multiple services, implement automatic rollback triggers based on metrics, and even integrate with traditional deployment tools to create unified deployment workflows. I predict that by 2026, the distinction between deployment tools and feature flag platforms will be largely academic.

The Automation Imperative and Its Limits

Every conversation about deployment strategies eventually comes back to automation. The pressure to automate deployment decisions is immense, and for good reason. Human judgment at 2 AM when a deployment is misbehaving is notoriously unreliable. But the teams that succeed with automated deployments understand the difference between automating execution and automating judgment.

Automated execution is relatively straightforward. If error rates exceed threshold X for duration Y, initiate rollback procedure Z. Automated judgment is much harder. Should you roll back a deployment that’s causing a 5% increase in response time but a 15% increase in successful transactions? The answer depends on context that’s often difficult to encode in simple rules.

What I’m seeing suggests that successful automation strategies focus on creating fast feedback loops rather than trying to automate every possible decision. Teams are building systems that can quickly surface deployment-related issues to human decision makers with enough context to make informed choices. My guess is that machine learning will eventually make automated deployment judgment more sophisticated, but we’re probably still years away from systems that can reliably make complex tradeoffs without human oversight.

The path forward isn’t about choosing the perfect deployment strategy. It’s about building deployment systems that can adapt their behavior based on the specific characteristics of each service and the current state of your production environment. If you’re working on deployment automation or have strong opinions about where these patterns are heading, I’d love to hear about your experiences in production environments.


Building Trust Through Code: A Senior Engineer’s Guide to Mentorship That Actually Works

The Foundation: Why Most Mentorship Programs Miss the Mark

After fifteen years of building distributed systems and watching countless mentorship attempts fizzle out, I’ve learned that most senior engineers approach mentorship like they approach architecture reviews. They focus on the big picture, the theoretical frameworks, the elegant patterns. The junior developer sits there nodding along while internally screaming because they can’t even get their development environment set up properly.

Building Trust Through Code: A Senior Engineer's Guide to Mentorship That Actually Works
Building Trust Through Code: A Senior Engineer’s Guide to Mentorship That Actually Works

The disconnect isn’t malicious. We’ve just forgotten what it feels like to stare at a blank terminal, wondering if typing “git init” will somehow blow up the entire codebase. We’ve absorbed so much knowledge that we skip the foundational steps that make or break a junior developer’s confidence in those first few months.

Good mentorship starts with understanding one thing: trust isn’t built by dispensing wisdom from your ivory tower. You earn it in the trenches, one working solution at a time. When you help someone solve their immediate problem instead of lecturing about theoretical best practices, you create space where actual learning can happen.

Illustration for Building Trust Through Code: A Senior Engineer's Guide to Mentorship That Actually Works
Illustration for Building Trust Through Code: A Senior Engineer’s Guide to Mentorship That Actually Works

Start Small: The Power of Immediate Wins

The first thing I do with any junior developer? I ignore whatever grand learning plan HR has cooked up and focus on one question: what’s the smallest, most concrete thing we can build together that will actually ship to production? Not a tutorial. Not a practice exercise. Real code that real users will interact with.

Last month, I worked with a new graduate who was completely overwhelmed by our microservices architecture. Instead of diving into service discovery patterns or explaining how our message queues work, we spent two hours building a simple health check endpoint. One route, one response, one commit. She deployed it to staging, watched it work, and suddenly the entire system felt less like some incomprehensible monster. When someone can point to running code and say “I built that,” something fundamental shifts in how they relate to the codebase.

This approach works because it creates a feedback loop of competence. Each small success builds confidence, which makes the next challenge feel doable instead of impossible. I’ve seen junior developers go from paralyzed by imposter syndrome to confidently proposing architectural changes within six months. The difference? We started with wins they could understand and own.

The trick is choosing problems that are genuinely useful but don’t require deep system knowledge. Add logging to an existing endpoint. Write a script to automate some tedious manual step. Build a simple dashboard that queries existing APIs. These tasks teach real skills while contributing actual value. That matters way more than any abstract coding exercise ever could.

Code Reviews as Teaching Moments

Code reviews are where mentorship either takes off or crashes and burns. I’ve watched senior engineers absolutely destroy junior developer confidence with reviews that read like academic papers. Full of abstract principles but zero practical guidance. The junior developer submits their first pull request, excited to contribute, only to get seventeen comments about variable naming conventions and a link to some 200-page style guide.

My approach is different. I limit myself to three real comments per review, and at least one has to be positive and specific. Instead of writing “this violates single responsibility principle,” I’ll say “this function is doing two things. Let’s pull the validation logic into its own method. Here’s how I’d approach it.” Then I include a code snippet showing exactly what I mean.

The most important part happens after the written feedback. I schedule a fifteen-minute call to walk through the changes together. Screen sharing, live coding, explaining my thought process as I refactor their code. This turns code review from a judgment session into collaborative problem-solving. The junior developer gets to see how experienced engineers actually think through problems in real time, which beats any written feedback by miles.

I also make sure to call out what they did well. Not generic praise, but specific observations about good decisions they made. “You handled the error case here really thoughtfully” or “This variable name makes the intent crystal clear.” This builds pattern recognition for what good code looks like. Junior developers often can’t tell the difference between their good instincts and their mistakes. Explicit positive feedback helps calibrate their judgment.

Building Systems Thinking Through Real Problems

You can’t teach systems thinking with diagrams on whiteboards. It happens when junior developers hit real problems that force them to trace connections between different parts of the codebase. My favorite technique? “Following the data.” When someone asks how something works, instead of explaining it, I walk them through tracing a single request from the browser all the way to the database and back.

We start with the network tab in Chrome DevTools, looking at the actual HTTP request. Then we find the route handler in the code, follow the service calls, examine the database queries, and track the response back up the chain. This isn’t theoretical. We’re looking at real logs, real database records, real network traffic. By the end, they understand not just how this one feature works, but how to investigate any feature in the system.

I ramp up complexity gradually. First, we trace through happy path scenarios. Then edge cases. Then error conditions. Eventually, we’re debugging production issues together, and they’re asking the right questions because they understand how to follow the data flow. This builds genuine debugging skills rather than just knowledge about our particular tech stack.

The goal isn’t to make them experts overnight. It’s to give them a systematic way to understand complex systems. Once they can trace through one request end-to-end, they can trace through any request. That’s a skill they’ll use regardless of what technologies they encounter next.

Creating Safe Spaces for Failure

The most important thing you can do as a mentor? Make failure normal. Not catastrophic production outages, but the small failures that happen every day in development. The misnamed variables, the overlooked edge cases, the features that work perfectly until they hit real user data and explode in weird ways.

I share my own screw-ups constantly. When reviewing their code, I’ll mention similar bugs I’ve written. “I spent three hours debugging this exact same issue last year. Here’s what I learned.” When they’re struggling with a concept, I’ll talk about when I first ran into it and what confused me. This isn’t fake humility. Learning complex systems is genuinely hard, and struggle is normal, not shameful.

I also create deliberate opportunities for low-stakes experimentation. Feature flags let junior developers deploy code that only affects internal users at first. Sandbox environments let them break things without consequences. Pair programming sessions where I’m explicitly there to help recover from mistakes take away the fear of trying new approaches.

What I’m aiming for is what I call “productive confidence.” Not arrogance that leads to reckless changes, but the quiet assurance that they can figure things out, fix their mistakes, and ask for help when they need it. This mindset separates engineers who grow quickly from those who plateau early because they’re too scared to take risks.

Mentorship that actually works isn’t about downloading knowledge from senior to junior. It’s about creating conditions where junior developers can build real expertise through guided practice with actual problems. If you’re a senior engineer reading this and you recognize some of your own mentorship struggles, I’d love to hear what’s worked for you. The best approaches always come from comparing notes about what actually moves the needle in those crucial early months of someone’s career.


Why Your Database Optimizations Keep Failing (And The One That Actually Worked)

Three years ago, I watched our primary database server’s CPU spike to 98% at exactly 2:17 PM on a Tuesday. The query that brought us to our knees was supposed to be simple: fetch user preferences for our mobile app’s notification system. What should have taken 50 milliseconds was taking 15 seconds. Our monitoring showed 50,000 users were getting timeout errors. The fix everyone suggested was obvious: add an index. That fix made things worse.

Database optimization failures follow predictable patterns. Most teams jump straight to indexing without understanding their query patterns. They tune individual queries without seeing the bigger picture. They optimize for their current data size, not the dataset they’ll have in six months. The war stories pile up fast when you approach performance problems this way.

The Index Trap That Catches Everyone

Adding indexes feels like the universal solution to slow queries. The thinking goes: slow SELECT means missing index, so add one. But indexes aren’t free. Every additional index slows down INSERT and UPDATE operations because the database has to maintain those index structures. Worse, the query planner can choose the wrong index, leading to performance that’s actually slower than a table scan.

In our notification query disaster, the table already had twelve indexes. Adding a thirteenth for our specific WHERE clause created chaos where the planner would sometimes choose our new index, sometimes choose an existing partial index, and sometimes do a full table scan. The unpredictability hurt more than consistent slowness. The real problem wasn’t missing indexes. We were joining four tables and filtering on columns from three of them, forcing the planner into impossible choices.

The solution required rewriting the query to eliminate one join entirely by denormalizing user preference data into the main user table. Counter-intuitive, but it worked. Sometimes the best optimization is changing what you’re asking the database to do, not how you’re asking it to do it.

Query Plan Analysis Actually Matters

Most developers look at EXPLAIN output like it’s abstract art. Those numbers and operators tell a specific story about how the database plans to execute your query. Learning to read them isn’t optional if you want to solve real performance problems. The query planner is sophisticated, but it operates on statistics and heuristics that don’t always match your data’s reality.

I’ve seen queries where the estimated row count was 100 but the actual count was 50,000. The planner chose a nested loop join expecting to process a few rows and ended up doing millions of comparisons. The fix wasn’t an index or a configuration change. We needed to update table statistics with ANALYZE commands and adjust the planner’s cost model for our specific hardware.

Modern databases like PostgreSQL provide detailed execution statistics through pg_stat_statements. This extension tracks every query’s execution count, total time, and resource usage. When you’re hunting performance problems, this data shows you exactly which queries eat the most cumulative time. Often the slow query everyone notices isn’t your biggest problem. The query that runs 10,000 times per minute at 10ms each creates more load than the one that runs once per hour at 5 seconds.

Connection Pooling and Resource Contention

Database connections aren’t just network sockets. Each connection consumes memory for caching, transaction state, and temporary work areas. When your application creates 500 connections to handle traffic spikes, you’re not just using network resources. You’re fragmenting the buffer pool and forcing the database to context-switch between hundreds of processes or threads.

Connection pooling tools like PgBouncer or built-in application framework pools solve this by maintaining a fixed number of database connections and queuing application requests. But pooling creates its own headaches. Transaction-level pooling means you can’t use prepared statements across requests. Session-level pooling means long-running transactions can hold connections indefinitely. Statement-level pooling requires careful transaction management in your application code.

The configuration that worked for our team was session-level pooling with a maximum of 25 database connections per server, even though we had 200 application threads. This forced us to be disciplined about transaction scope and connection lifetime. Queries got faster because the database could maintain larger, more stable caches. The constraint improved our code quality by making inefficient database usage immediately obvious.

Storage and Memory Architecture Decisions

Database performance ultimately comes down to how efficiently you can move data between storage, memory, and CPU. Traditional spinning disks reward sequential access and large block reads. SSDs eliminate seek time penalties but have different characteristics around write amplification and wear leveling. NVMe drives can saturate your memory bandwidth before hitting storage throughput limits. Each storage tier requires different optimization strategies.

Memory configuration matters more than most teams realize. PostgreSQL’s shared_buffers setting determines how much data the database keeps in memory. Set it too low and you’re constantly reading from disk. Set it too high and you’re competing with the operating system’s buffer cache, effectively caching the same data twice. The sweet spot is usually 25% of total RAM, but it depends on your read/write patterns and whether you’re running other services on the same machine.

Work memory settings control how much RAM individual operations can use for sorting and hash joins. When a sort operation exceeds work_mem, it spills to disk and becomes dramatically slower. But setting work_mem too high means a few complex queries can exhaust your memory. This is where understanding your query patterns becomes critical. If you know your largest sorts need 500MB, you can tune accordingly. If you don’t know, you’re guessing.

The Optimization That Actually Worked

After three months of index tuning, query rewriting, and configuration adjustments, our biggest performance gain came from partitioning our largest table by date. This wasn’t a complex sharding scheme or distributed architecture. PostgreSQL’s native table partitioning let us split our 200-million-row events table into monthly partitions of 15-20 million rows each.

The improvement was immediate and dramatic. Queries with date filters only touched relevant partitions. Maintenance operations like VACUUM and ANALYZE ran against smaller datasets. Old data could be dropped by removing entire partitions instead of running DELETE statements. Most importantly, the query planner had better statistics and could make more accurate decisions about execution plans.

The lesson here is that some performance problems can’t be solved by tuning the database engine. Sometimes you need to change how your data is organized. Partitioning, archival strategies, and data lifecycle management are architectural decisions that have more impact than any amount of parameter tweaking.

Database optimization is detective work. Every slow query tells a story about your data access patterns, your schema design, and your application architecture. The tools and techniques I’ve described here aren’t magic bullets. They’re diagnostic methods that help you understand what’s actually happening when your database slows down. The next time you’re facing performance problems, resist the urge to add indexes immediately. Look at the query plans. Check your connection usage. Consider whether you’re asking the right questions of your data in the first place.


The Mentorship Trap: Why Most Senior Engineers Fail at Teaching

The Fundamental Misunderstanding About Technical Mentorship

After fifteen years of watching brilliant engineers fumble their way through mentorship relationships, I’ve come to an uncomfortable conclusion: we’re approaching this entirely wrong. The industry treats mentorship like it’s a natural extension of technical expertise, assuming that someone who can architect distributed systems can automatically teach others to do the same. This assumption has created more frustrated mentors and confused mentees than I care to count.

The Mentorship Trap: Why Most Senior Engineers Fail at Teaching

The core problem isn’t that senior engineers don’t want to help. Most of us remember the confusion of our early careers and genuinely want to pay it forward. The issue is that we’ve never been taught how to translate our hard-won knowledge into digestible, actionable guidance. We hand over our mental models like they’re complete instruction manuals, forgetting that these models took years to build and countless failures to refine.

I learned this lesson the hard way when I first started mentoring junior developers five years ago. My approach was to dump everything I knew about system design onto them, expecting they’d absorb it like a sponge. Instead, I watched talented engineers become paralyzed by information overload, second-guessing every decision because they couldn’t distinguish between critical principles and personal preferences. The mentorship relationship became a crutch rather than a launching pad.

Illustration for The Mentorship Trap: Why Most Senior Engineers Fail at Teaching

Why Traditional Code Review Mentorship Falls Short

Most mentorship in our field happens through code reviews, and this creates a systematic problem. Code review mentorship is reactive by nature. You’re always addressing what went wrong rather than building the mental frameworks that prevent problems in the first place. It’s like teaching someone to drive by only pointing out their mistakes after near-misses.

The feedback loop is also terrible. By the time you’re reviewing someone’s pull request, they’ve already spent hours or days going down the wrong path. The learning happens after the work is complete, when the context and decision-making process are already fading from memory. They learn to fix specific problems but miss the underlying reasoning that would help them avoid similar issues in the future.

I’ve seen senior engineers write detailed comments explaining why a particular approach won’t scale, complete with links to documentation and alternative implementations. The intent is good, but the mentee often walks away knowing what to change without understanding the deeper principles. They become dependent on the mentor’s judgment rather than developing their own.

The Pairing Paradox: When Shared Screens Create Distance

Pair programming seems like the obvious solution, and it can be incredibly effective when done right. But I’ve observed a consistent pattern: senior engineers tend to drive during pairing sessions, even when they don’t mean to. We see the solution path immediately and unconsciously steer the conversation toward it, robbing the mentee of the struggle that builds understanding.

The real learning happens in the messy middle, when someone is wrestling with a problem and testing different approaches. When we jump in too early with the “right” answer, we short-circuit this process. The mentee learns the solution but misses the problem-solving methodology that generated it. They become spectators in their own learning experience.

Effective pairing requires deliberate restraint. I’ve started using what I call “question-driven pairing,” where I limit myself to asking questions rather than providing answers. “What do you think will happen if we change this?” or “How would you test this assumption?” It’s slower and sometimes painful to watch someone work through something I could solve in minutes, but the retention and confidence building are dramatically better.

The key insight is that pairing should feel like collaborative problem-solving, not expert demonstration. When the mentee is actively thinking and making decisions, even wrong ones, they’re building the neural pathways that matter. When they’re passively watching, they’re just getting entertainment.

Building Systems Thinking Instead of Teaching Solutions

The most valuable thing we can teach junior engineers isn’t how to solve specific problems, but how to think about systems. This means shifting from solution-focused mentorship to principle-focused mentorship. Instead of explaining why microservices are good or bad for a particular use case, we should be teaching how to evaluate trade-offs systematically.

I’ve started structuring my mentorship around decision-making frameworks rather than technical knowledge transfer. When someone asks about database choices, we don’t just discuss PostgreSQL versus MongoDB. We talk about how to identify the constraints that matter, how to research options systematically, and how to make decisions with incomplete information. These meta-skills transfer across technologies and career stages.

This approach requires more patience because you’re teaching fishing instead of giving fish. But the compound returns are enormous. Engineers who learn to think in systems and trade-offs become force multipliers on their teams. They stop needing permission for every technical decision and start contributing to architectural discussions meaningfully.

The practical implementation involves a lot more “why” questions and a lot fewer “how” demonstrations. When reviewing someone’s design document, instead of suggesting better approaches, I ask them to walk through their reasoning. What assumptions are they making? What could go wrong? How would they know if it’s working? This builds the analytical muscles that separate senior engineers from junior ones.

The Long Game: Creating Independent Thinkers

The ultimate measure of successful mentorship isn’t how quickly someone learns to follow your patterns, but how effectively they develop their own judgment. This requires stepping back when every instinct tells you to step forward. It means letting people make recoverable mistakes and discover their own solutions, even when you could save them time and frustration.

I’ve started measuring my mentorship success by how often my mentees disagree with me. When someone has developed enough confidence and analytical skill to challenge my assumptions respectfully, I know the relationship is working. They’re thinking for themselves rather than deferring to my experience.

This evolution from dependent learner to independent contributor doesn’t happen overnight. It requires consistent investment in building someone’s confidence alongside their technical skills. The best mentorship relationships feel more like partnerships by the end, with both people learning from the exchange.

I’m still figuring this out, and I suspect every mentoring relationship requires its own approach. What I’ve shared here reflects my current thinking, shaped by recent experiences and ongoing reflection. I’d be interested to hear how other senior engineers have approached these challenges, especially if you’ve found different patterns that work better.


Building Your First CI/CD Pipeline: The Foundation Principles That Actually Matter

Start With the Problem, Not the Tools

After watching countless teams stumble through their first CI/CD implementations, I’ve learned that the biggest mistake isn’t picking the wrong tool or writing imperfect scripts. It’s starting with technology instead of understanding what problem you’re actually solving. Before you touch Jenkins, GitHub Actions, or any other platform, sit down and map out your current deployment process. Write down every single step someone takes to get code from a developer’s machine into production.

Building Your First CI/CD Pipeline: The Foundation Principles That Actually Matter

This exercise reveals the truth about your workflow. You’ll discover manual steps you forgot existed. You’ll find places where knowledge lives in only one person’s head. You’ll uncover dependencies that seem obvious until they break. I once worked with a team that spent three weeks building an elaborate pipeline only to realize they had no consistent way to handle database migrations. Their beautiful automation fell apart the moment someone needed to update a schema.

The goal isn’t to automate everything right away. Start by identifying the most painful, error-prone, or time-consuming parts of your process. Maybe it’s that twenty-minute manual deployment ritual that requires three terminal windows and a prayer. Maybe it’s running tests that developers skip because they take too long. Focus on automating one piece well rather than trying to solve everything at once.

Design for Failure From Day One

Your pipeline will fail. Not might fail, will fail. The question isn’t whether to plan for failure, but how to make failure visible, understandable, and recoverable. I’ve seen teams spend months perfecting their happy path only to watch everything crumble when a test flakes or a dependency goes missing. The systems that survive in production are the ones built with failure as a core concern.

Start with clear, actionable error messages. When your build breaks at 2 AM, the person fixing it might not be the person who wrote the code. Your pipeline output should tell them exactly what went wrong and what steps to take next. Instead of “Build failed,” write “Unit tests failed in user authentication module. Run ‘npm test auth’ locally to reproduce.” Instead of “Deploy error,” write “Connection to staging server timed out. Check VPN connection and server status at [link].”

Build in rollback mechanisms from the beginning. Your first deployment might work perfectly, but your fiftieth might introduce a critical bug. Having a reliable way to return to the last known good state isn’t just good practice. It’s what lets you sleep at night. This doesn’t have to be sophisticated initially. A simple script that redeploys the previous version will save you hours of panic debugging when something goes wrong.

Create circuit breakers for external dependencies. If your pipeline depends on a package repository, container registry, or third-party API, plan for what happens when those services are unavailable. Cache dependencies when possible. Use retries with exponential backoff. Have alternative paths or graceful degradation strategies. The internet is unreliable, and your pipeline needs to account for that reality.

Keep It Simple, But Not Simplistic

The best CI/CD pipelines I’ve encountered follow a deceptively simple pattern: trigger, build, test, deploy. But within that simplicity lies tremendous depth. Each stage should have a single, clear responsibility. Your build step produces artifacts. Your test step validates those artifacts. Your deploy step moves validated artifacts to their destination. When stages have overlapping responsibilities, debugging becomes exponentially harder.

Resist the urge to optimize too early. Your first pipeline doesn’t need to be the fastest, most feature-rich system imaginable. It needs to be reliable, understandable, and maintainable. I’ve seen teams spend weeks parallelizing builds that took four minutes, then struggle for months with race conditions and flaky tests. Start with a linear pipeline that works every time, then optimize the bottlenecks you actually encounter.

Make everything reproducible. Your pipeline should produce identical results whether it runs on your laptop, a colleague’s machine, or your CI server. This means pinning dependency versions, using containerization or virtual environments, and avoiding any configuration that lives outside your code repository. If someone can’t run your build locally and get the same result as the CI system, you have a ticking time bomb.

Document your decisions, especially the ones that seem obvious. Six months from now, you won’t remember why you chose to run integration tests before unit tests, or why you decided to deploy to staging automatically but require manual approval for production. Your future self, and your teammates, will thank you for leaving breadcrumbs.

Test Your Tests Before You Trust Them

A pipeline is only as reliable as the tests it runs, and unreliable tests are worse than no tests at all. They create a false sense of security when they pass and train developers to ignore failures when they flake. Before you automate test execution, make sure your tests themselves are worth automating.

Start with tests that run quickly and fail clearly. Unit tests should execute in seconds, not minutes. Integration tests should set up their own data and clean up after themselves. End-to-end tests should focus on critical user journeys rather than trying to cover every possible interaction. Each category has a different purpose, and mixing them leads to confusion about what’s being validated.

Create proper test isolation. Tests that depend on shared state, external services, or specific execution order will eventually cause mysterious failures that eat hours of debugging time. I once tracked down a pipeline failure to a test that only failed when run on Tuesdays, because it was checking the current date against a hardcoded value. Every test should be able to run independently and produce the same result regardless of when or where it executes.

Plan for test maintenance from the start. Tests require ongoing care just like production code. Set up clear ownership for different test suites. Create processes for updating tests when functionality changes. Build monitoring to detect when test suite execution time starts growing or flake rates increase. Neglected tests become technical debt that slows down the entire development process.

Your Next Step Forward

These principles might seem overwhelming if you’re staring at a blank CI/CD configuration file, but remember that every expert was once a beginner. Start with the smallest possible implementation of these ideas. Pick one manual step in your current process and automate it reliably. Add basic error handling and documentation. Run it a few times, learn what breaks, and fix those issues before moving to the next step.

The best way to understand these principles is to build something real with them. What manual deployment step is causing your team the most pain right now? That’s your starting point. I’d love to hear about what you’re building and what challenges you encounter along the way. Feel free to share your experiences or ask questions in the comments.